Looked up trends for historical data, over the span of several years for dragging time-axis, time syncing of Multi-Trends, and unlimited traces, etc..
Process Graphics
Graphical representation of your Plant’s process, complete with real-time values, calculated variables, dynamic animations, Alarm and etc..
Tag Views
Filter the tag list by multiple criteria such as name, description, data source and process area from the Data Sources to visualize the Data…
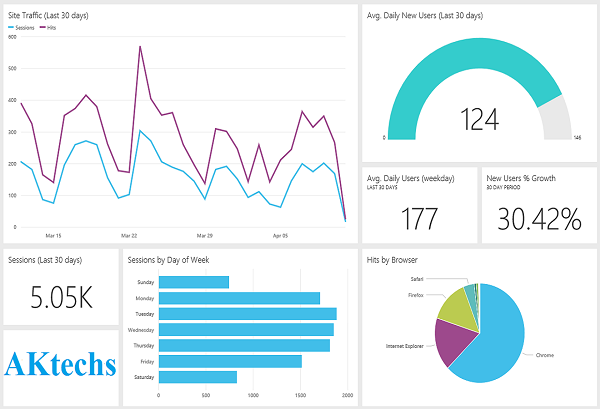
Dashboard Displays
Dashboard Displays with real-time visibility to key performance indicators (KPIs) on live gauges and embedded charting tools.
If your goal is to communicate information clearly and efficiently to users, contact us immediately and we will visualize your data for your business growth.